Imagine you are planning a day out. One where getting it wrong is not simply inconvenient. It is exhausting. Maybe overwhelming. Maybe the reason you do not go out again for two weeks.
You search online. You find a venue. The reviews say it is vibrant and buzzing. The photos show smiling people. The website says it is welcoming to all.
But none of that tells you what you actually need to know.
How loud does it get on a Saturday afternoon? Is there anywhere quiet to sit if it becomes too much? Will the lights be harsh? Will it feel like the walls are closing in?
For millions of neurodivergent people, including autistic adults, people with sensory processing differences, and anxious parents planning a family trip, this is not a small gap. It is the gap between participating in city life and not participating at all.
MindHaven was built to close that gap. At the heart of it sits something we call ComfortScore.
What Is ComfortScore?
ComfortScore is a number between 0 and 1 that tells you how comfortable the environment around a venue is likely to feel before you ever set foot inside.
It does not measure popularity. It does not measure reviews. It measures how the environment actually feels in structural and physical terms.
The score is built from four factors that we can measure using publicly available data. There is no tracking, no surveys, and no guesswork.
QuietScore measures the level of environmental noise surrounding a venue, using official government noise maps. A park in Hampstead scores differently from a café beside a main road. This is not opinion. It is measured acoustic data.
GreenScore measures how much vegetation is nearby, calculated from satellite imagery. Green space is not just pleasant. Research consistently links it to reduced stress, lower sensory load, and improved emotional regulation.
CrowdScore reflects how structurally busy the surrounding area tends to be. It is derived from the density of nearby activity points such as shops, transport hubs, and venues. Quieter areas score higher.
AccessScore reflects whether a venue has recorded accessibility features in open mapping data. This component is explicit about its limits. Where data is incomplete, we say so clearly rather than presenting a false sense of certainty.
These four components are combined into a single ComfortScore. Every number is traceable. You can see exactly why a venue scored as it did. There are no black boxes, no hidden logic, and no proprietary data.
Why We Did Not Use Personal Data
This is the part that matters most to us.
Many platforms that attempt to personalise urban experiences do so by tracking where people go, how long they stay, and what they do. That information is sensitive, ethically complex, and often collected without meaningful consent.
We chose a different path.
ComfortScore is built entirely from environmental data about places rather than data about people. No individual movements are tracked. No behaviour is recorded. The city itself is measured as a physical structure, including its noise, greenery, and spatial density.
This approach means ComfortScore can be applied anywhere that open data exists. It can be updated as cities evolve. It can be independently audited. Most importantly, it never requires someone to trade their privacy for information they need to feel safe and prepared.
What the Research Actually Found
For my MSc dissertation at Middlesex University London, supervised by Dr David Windridge, I tested ComfortScore across 1,212 venues in Camden and Islington, two of the most varied inner city boroughs in London.
Even within this relatively small area, the variation was substantial. The quietest and greenest venues scored as high as 0.83. The noisiest and most activity dense areas scored as low as 0.14. These patterns aligned closely with what residents and planners already know about these neighbourhoods. The framework was not producing arbitrary values. It was capturing something real.
We also tested the stability of the score. The weighting between components was adjusted. Different mathematical aggregation methods were applied.
The rankings remained largely unchanged. Venues that scored highly under one method scored highly under nearly every reasonable alternative. That consistency is a key indicator of robustness in any measurement framework.
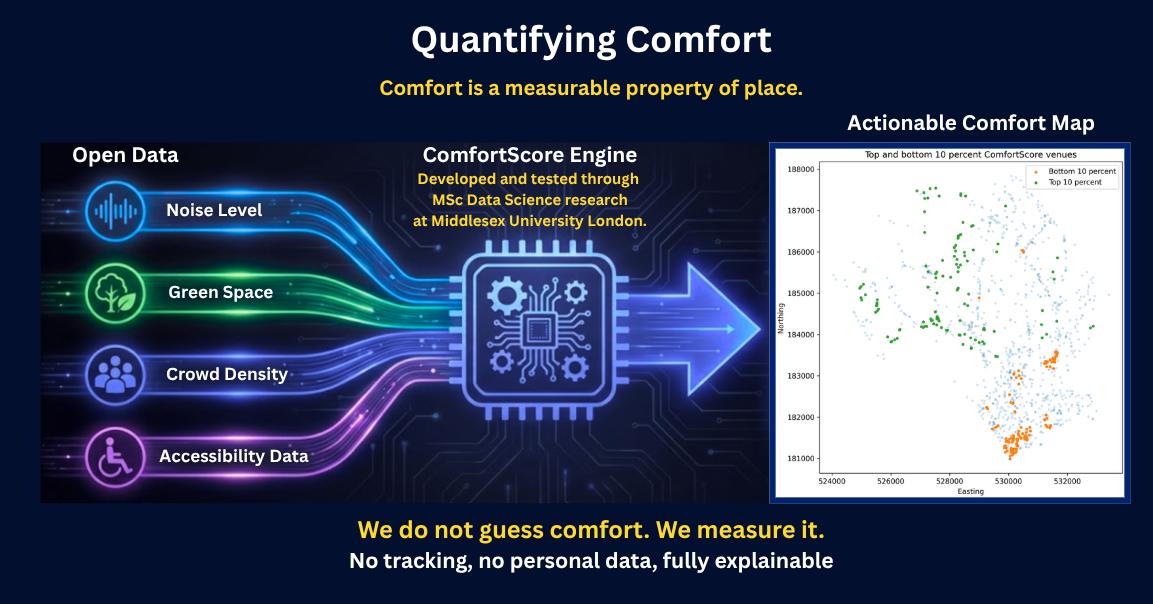
Figure 1. The ComfortScore framework combines open data on noise, green space, crowd density, and accessibility into a transparent scoring engine tested through academic research. The map shows clustering of the highest and lowest scoring venues across Camden and Islington, highlighting measurable variation in environmental comfort.
A Child Born Today
When Michael Faraday demonstrated electromagnetic induction in 1831, a sceptic reportedly asked what use it had. Faraday responded with a simple question of his own.
“What use is a newborn baby?”
A newborn cannot yet walk or change the world. Yet within that small and fragile thing lies every future possibility.
ComfortScore is a newborn in that sense. Today it measures four environmental signals across London. Tomorrow it could inform architectural decisions before a building is constructed, support councils in prioritising green investment, and help planners design calmer neighbourhoods from the ground up.
For local authorities, this has direct relevance. ComfortScore can act as a structural diagnostic tool. It can highlight where environmental stress is concentrated, where green infrastructure is lacking, and where accessibility may be underrepresented in existing data. It turns abstract discussions about wellbeing into measurable spatial evidence that can support policy decisions at neighbourhood level.
A child has been born. It needs care, development, and time. The framework is sound, and the direction it points towards cities that are kinder, measurable, and honest about their impact on human experience is worth following.
What This Means for You
If you use MindHaven, ComfortScore is working quietly in the background each time you view a venue.
It does not tell you whether you will enjoy a place. That choice remains yours. It tells you what the surrounding environment is like in terms you do not need to trust blindly, because the data is open and the method is explained.
No sensory surprises. No reliance on reviews written by people for whom noise is not an issue. Just clear, structural environmental information provided before you decide.
This is what we built. This is what we are continuing to build.
One day, we hope this becomes the normal way cities describe themselves. Until then, we will continue measuring what matters.
ComfortScore was developed as part of an MSc Data Science dissertation at Middlesex University London, supervised by Dr David Windridge. The framework uses only open environmental data including government strategic noise maps, satellite derived vegetation indices, and OpenStreetMap infrastructure data. No personal or behavioural data is used at any stage.
Get notified when we go live
Be first to access personalised comfort scores, curated activities & neuro-friendly spaces.
Founder of MindHaven and developer of the ComfortScore framework. PhD in Physics, MSc in Data Science, Middlesex University London. Building open, ethical infrastructure for more inclusive cities.